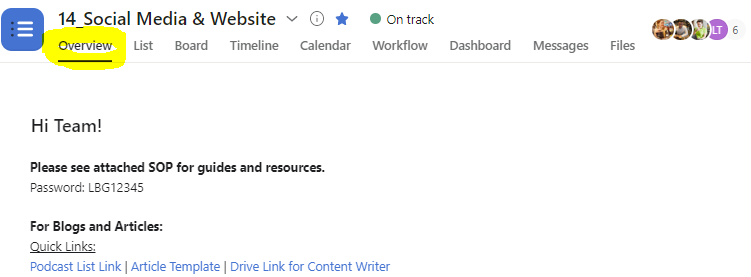
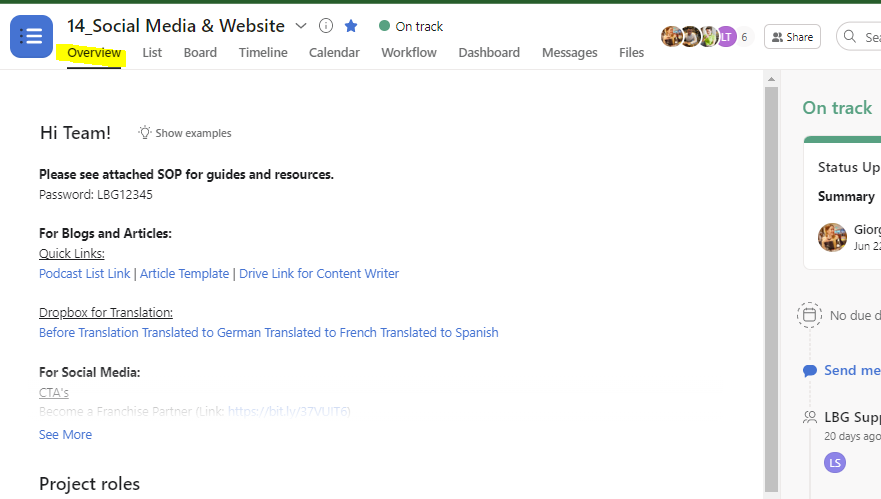
Go to 14_Social Media & Website – Asana Overview
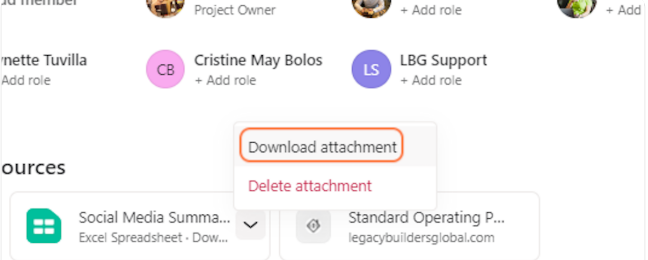
Look for the “Social Media Report” attachment at the very bottom of the page under the “Key resources” section, and click on show options.
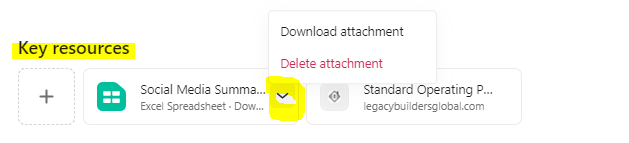
Click on Download attachment
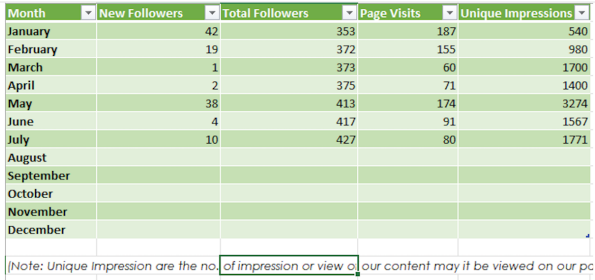
Open the excel sheet on your PC or laptop. Fill out the current month’s data
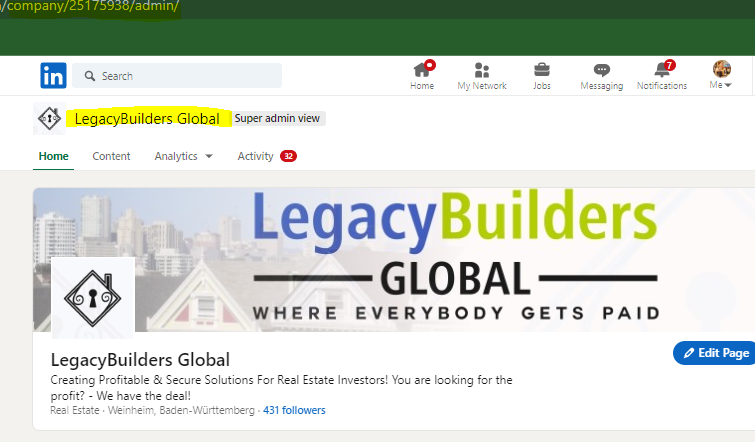
For LinkedIn New and Total Followers, go to LegacyBuilders Global: Company Page Admin | LinkedIn
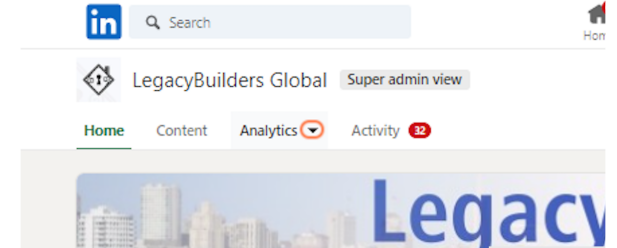
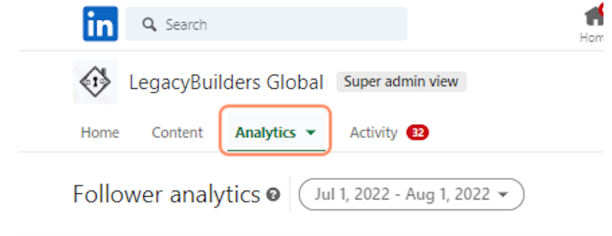
Click on Organization’s page Analytics
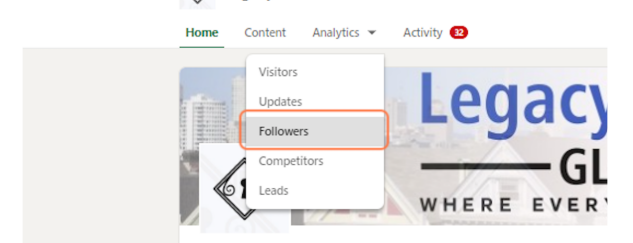
Click on Followers
Click on the date fields header
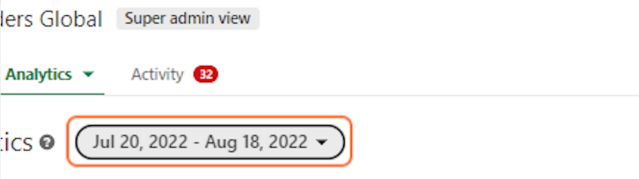
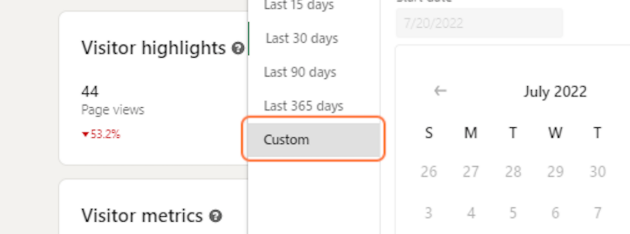
Click on Custom
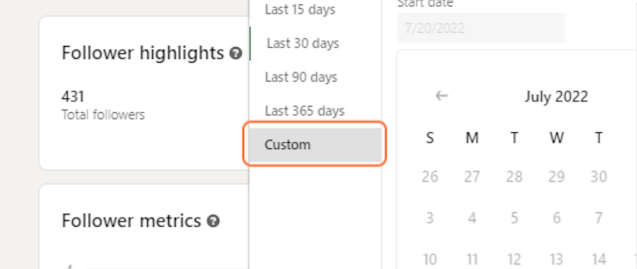
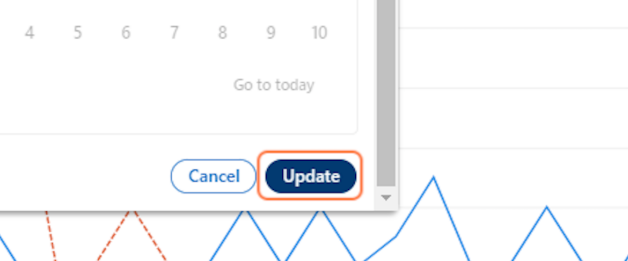
Select the dates for the month’s report
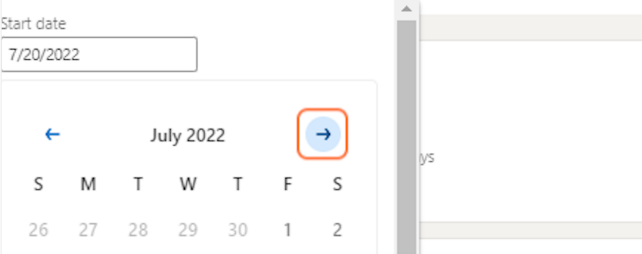
Click on Update

Total and New Followers will show on the “Follower’s Highlights“
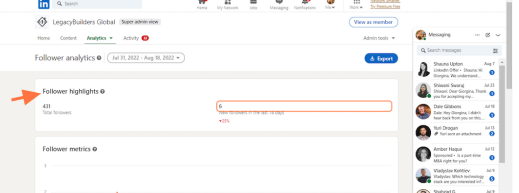
Insert the data into the excel sheet

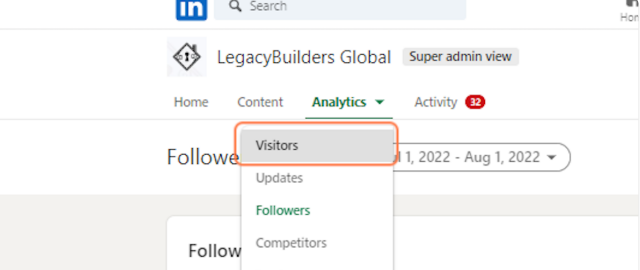
To generate the report for “Page Visits“, click on Organization’s page Analytics navigation again
Click on Visitors
Click on the date fields header
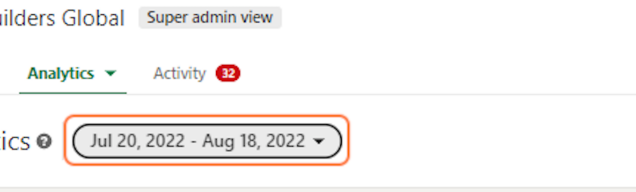
Click on Custom and select the dates your want to generate
Click on Update
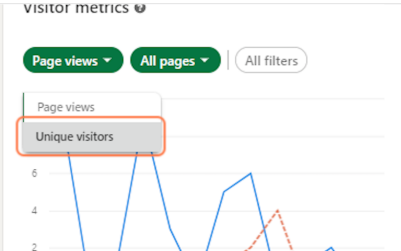
Click on Page Views
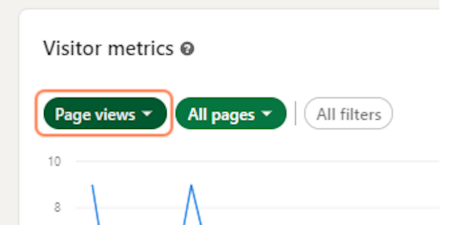
Click on Unique visitors
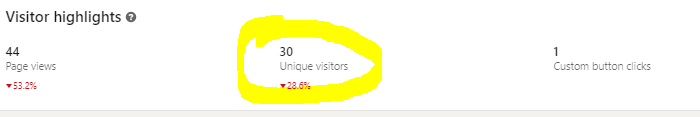
Total “Unique Visitors” for the month would be the data you will need to put under Page Visits on your excel sheet.
Once done inputting Page Visitor, click on Organization’s page Analytics navigation again to look for a Unique Impression
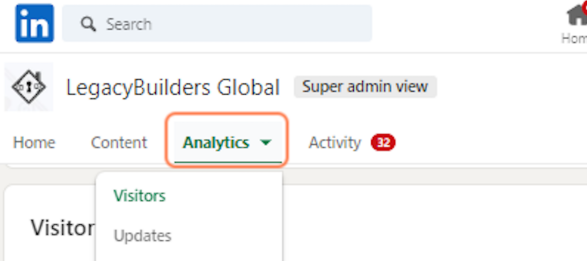
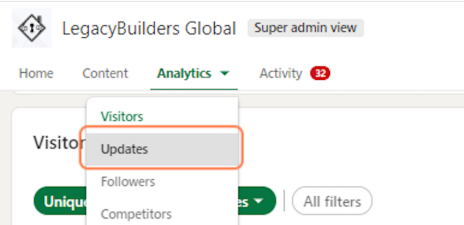
Click on Analytics, then Updates
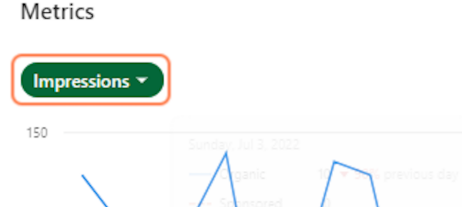
Click on Impressions
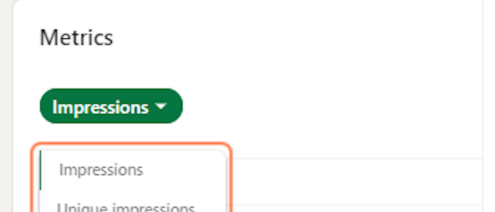
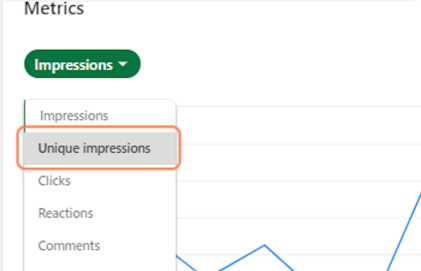
Select Unique impressions
Narrow down the report by clicking on the arrow from the date fields
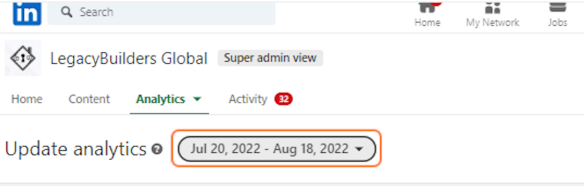
Click on Custom, then select the dates of the month you’re generating the report

Click on Update
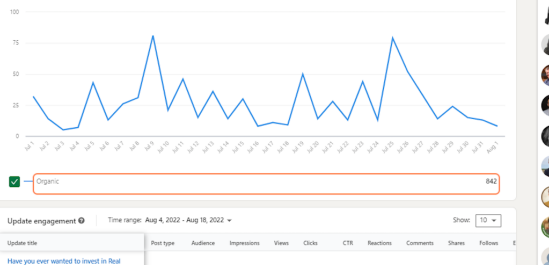
Click on Impressions
Click on Unique impressions
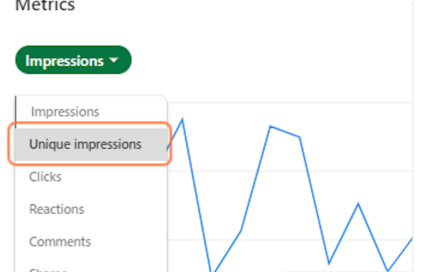
The total organic data will be the data you will need to put in the Unique Impressions section in the excel sheet
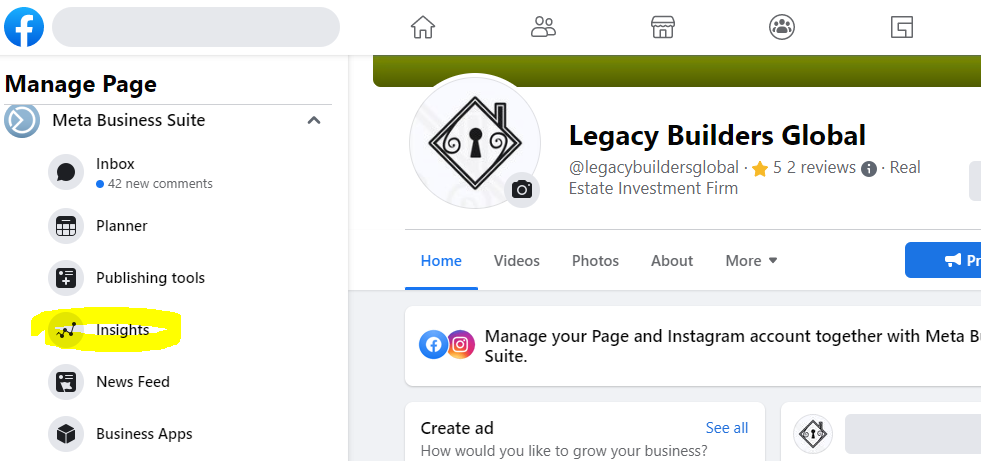
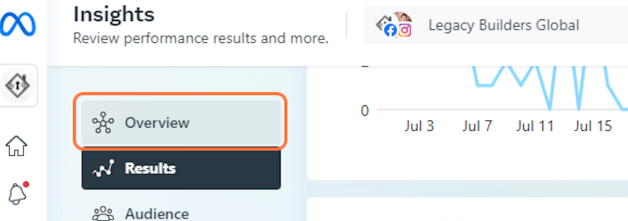
Once done with LinkedIn, do the same in generating reports to other platforms. For Facebook, go to LegacyBuilders Global Facebook page then look for Insights. Look for Followers, then click
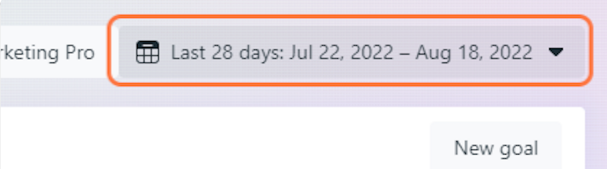
Click on the date field located at the top right corner of the screen
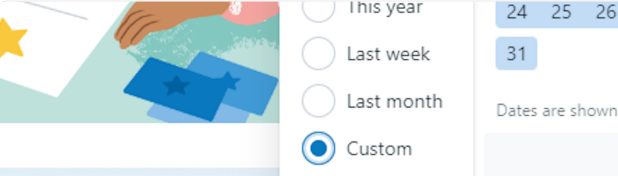
Click on the radio group
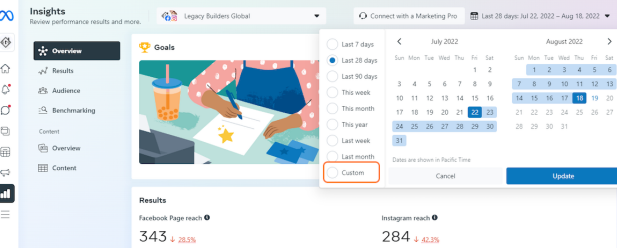
Select “Custom“
Choose the first and last date of the month’s report you are generating
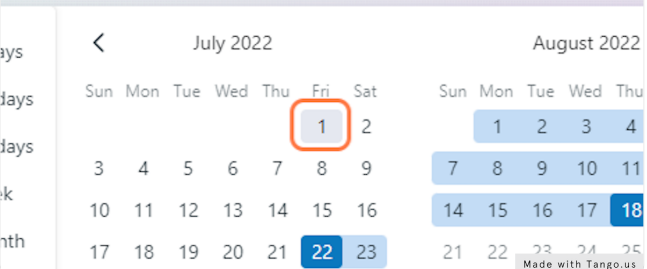
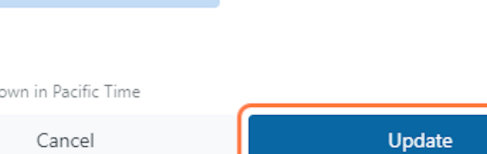
Click on Update
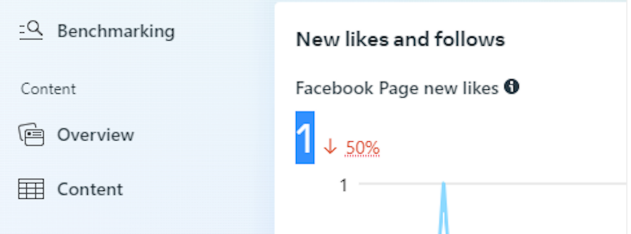
Click on Results
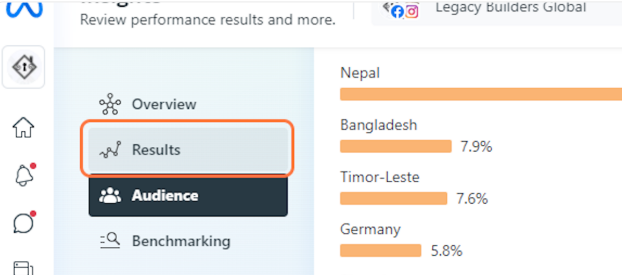
Look for “Facebook Page new likes” it’s beneath “New likes and follows” then enter the data on the excel sheet under “New Followers“
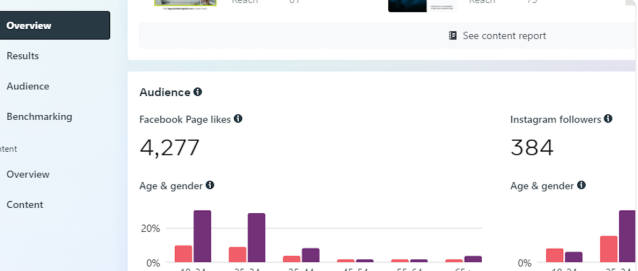
To locate the total followers, click on Overview
Look for the “Audience” section. Underneath that would be the data for the “Total Followers“. Once done inputting the data to the excel sheet, it’s now time for you to generate the “Page Visits“
Click on “Results“
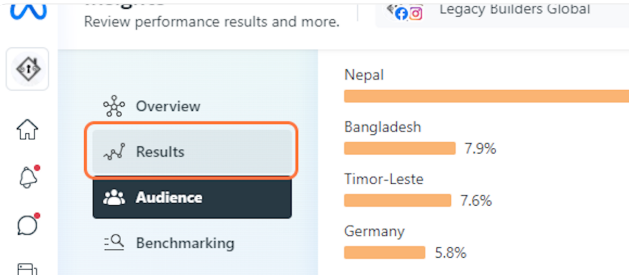
Look for “Page and profile visits“. Underneath that will be the data for the Page Visit section on your excel sheet.

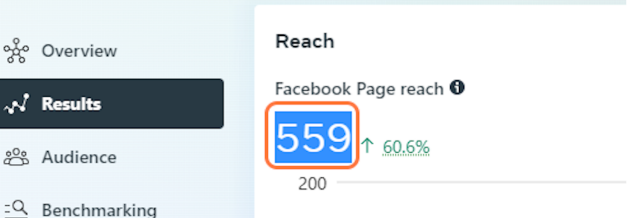
To generate “Unique Impressions“, locate the “Reach” section. Underneath that will be the data for the “Unique Impressions” section in your excel sheet.
Now that you’re done generating the Facebook report, it’s now time to generate the Instagram report. Do the same process you’ve done in the above’s Facebook instruction to generate this information.
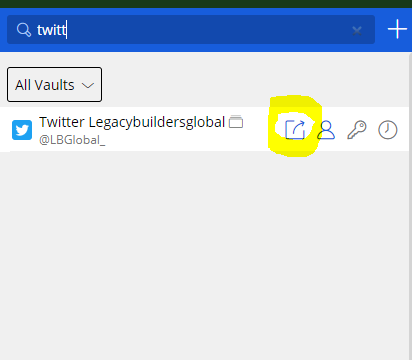
To generate a report for Twitter, log in to the Twitter account by using Bitwarden. If you do not know how to use Bitwarden, then please check out the “How to Use Bitwarden” SOP
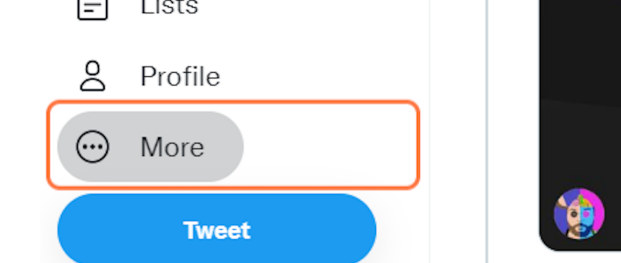
Once you’re logged in to Twitter, you will see the home dashboard.

Click on More
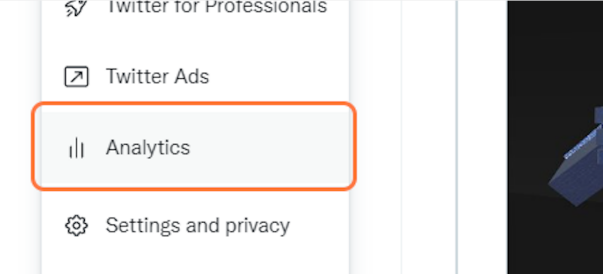
Click on Analytics
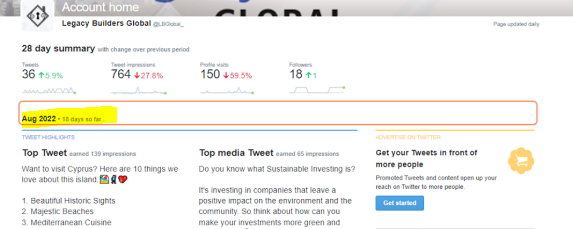
Locate the month’s report you are working
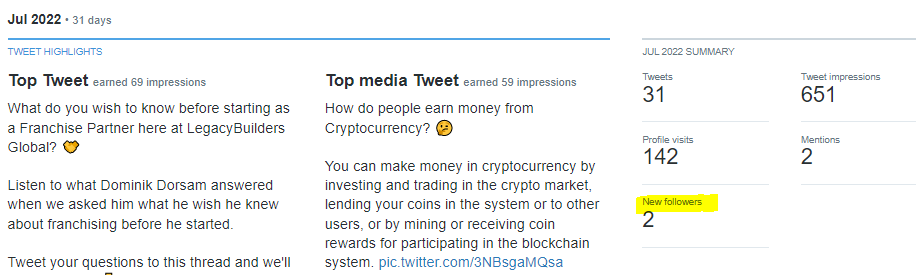
New Followers data can be found here
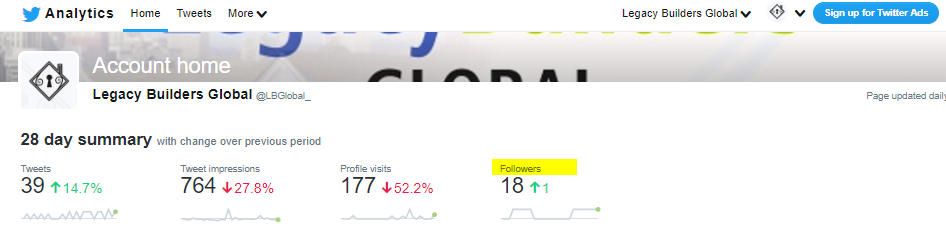
Total followers data can be found here
Page Visit data can be found here

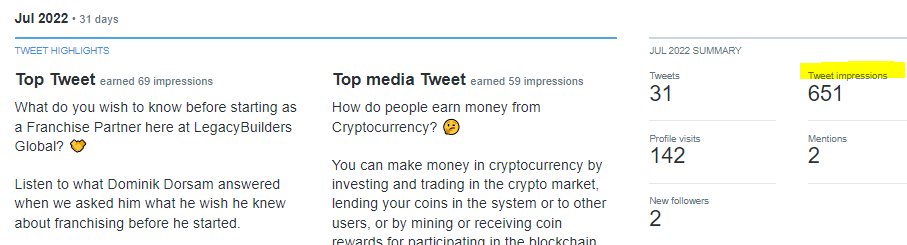
Unique Impressions data can be found here
Once you’re done filling in all data from all the platforms, save the file in your pc/laptop. Once done saving, it’s now time to submit the report. Go to 14_Social Media & Website – Asana Overview
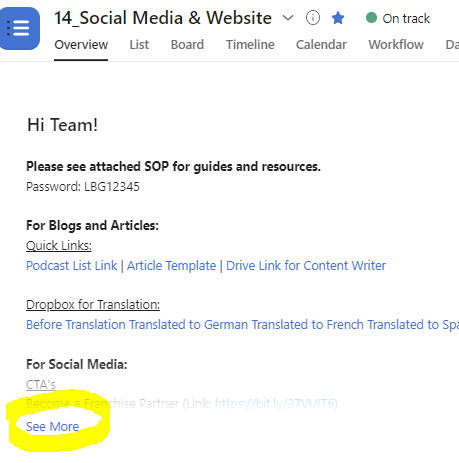
Click on See More under the project description
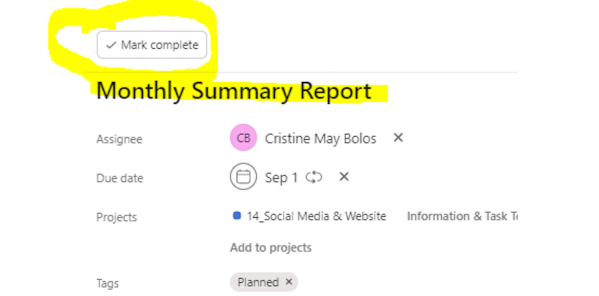
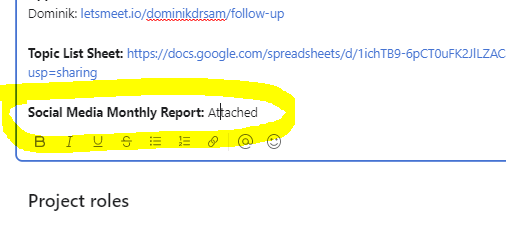
Type in month’s year Social Media Report attached. e.g July 2022 Social Media Report: Attached
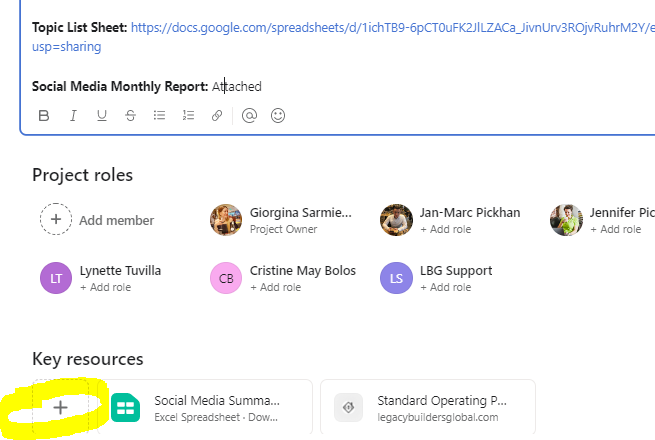
Attach the file by clicking the ( + ) plus button under Key resources
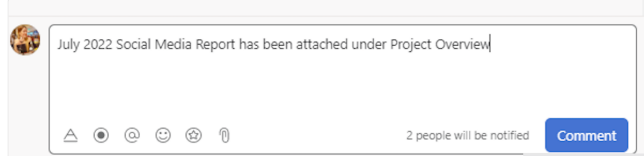
Once done attaching, add a comment on the task assigned to you. e.g July 2022 Social Media Report has been attached under Project Overview
Mark the task Complete